9 Key Metrics To Track Your Product Performance

Do you know how successful your product is? And what are the opportunities to increase its success and profitability? Let’s look together at the most relevant Metrics and KPIs you should track for your products. This will give you the necessary information to drive higher performance and success for your product in 2020. Besides, it can also help you make a case to get them internally tracked and reported.
1/ Product Technical Performance Metrics
That’s the basics..too often forgotten. When you build a product, you want it to answer certain functional needs. You also need it to work seamlessly from a technical standpoint. The perfect product is not necessarily what you should aim at (and it might actually not exist). This is why you need to make sure you have good visibility on its overall quality from a technical standpoint.
Defects
number of new defects, the average time to solve one (in both cases segment & qualified by criticality).
Down time
frecuency, lenght, impact.
Response time
in seconds, vs. competition & best practices, per region.
These metrics will increase your confidence that you can push your product to the market and show sales forces and customers how good your product is.
When these metrics are not satisfying, you’ll be able to ring the alarm, review the IT approach, or improvement priorities. It will be specifically useful to build a case to get additional resources to optimize one area of your product.
2/ Product Business Performance Metrics
That’s also the basics, but sometimes it is not so easy to measure, specifically if your product is free. In that case you’ll rather look at the indirect impact on business KPIs or product usage metrics. The purpose of measuring business performance is to know how successful is your product from a business standpoint meaning how much it does contribute to the top and bottom line of your organization. It is key to have a picture at instant…but also to look at the evolution of these metrics and compare it with your (business) plan and forecasts.
Top Line
When your product generates revenues, that’s the most obvious thing to look at. You’ll look at it based on the last period (day, week, month), from the beginning of the current year aka Year-to-Date (YTD), versus the Year before aka Year-on-Year (YoY), etc. You’ll look at the type of revenue very closely and build separate metrics for Recurring revenue and One-Off revenue.
Bottom Line
The other key, and actually often most important criteria, is the bottom line, or margin. You can make a whole lot of revenues but if you lose 2$ for every 1$ of revenue, you’ll not go very far. Same as for revenues, you’ll want to have a dynamic view on this to ensure things are evolving in the right manner.
3/ Lead Management Metrics
You certainly have various sources of leads. Whether they are coming from events, sales hunters, referrals, or from the website, they all deserve to be tracked, specifically as they convert (or not) to customers. It will also help your measure Marketing ROI (will come back to that later).
Lead generation/ New
Amount of new leads per week, avg. potential of each lead. Amount of new marketing qualified leads (MQL) per week, the amount of new sales qualified leads (SQL) per week,
Lead nurturing/ Sales funnel conversion
Percentage of lead that converts to MQL and then to SQL.
Penetration/ New customers
Amount of new customers per week (or other frequency). If you work with subscriptions, make a split between paying and free new customers. Variation vs. last year for the same period gives you a good view of your growth.
4/ Engagement & Product Usage Metrics
Beyond technical and business performance, a key indicator that will help you drive the success of your product is a better understanding on the ways and purpose your product is used. This will help you understand customer behaviors and expectations. All measures of adoption and engagement and worthwhile. Among some of the main metrics you can track:
General
Total amount of customers, total amount of core actions per week, traffic.
Engagement/ Existing customers
Weekly active users, amount of core tasks done per user per month (i.e. purchase).
Average session time
NPS
How many customers would recommend your product to others?
Customer service
Amount of support tickets created, First response time, Time to close support ticket, Satisfaction regarding the way their request was support team (as a rate between 1 to 5 for example)
There are many more metrics linked to product usage & engagement. What you’ll track will depends widely on your product nature and business model. In the end, what you want to understand is what is working well in your product, what is not, and whether your growth indicators are all positives…and why they are not (when it happens).
5/ Cross & Up Selling Metrics
Your product might be (or includes) value-added services or side products that can deliver additional sense for your users. Identifying and monitoring these opportunities will allow you to measure your product & business potential as well as your ability to convert potential into actual performance.
Potential
Total amount of Cross & Upselling opportunities, total amount of converted opportunities
Adoption
Total penetration of users converted to value-added service X (Y or Z)
Again here, the time dimension is useful to complement these criteria to form great metrics.
6/ Retention Management Metrics
Retention is probably one, if not the most important, growth driver of your business. See this very explicit graph if you are not convinced.
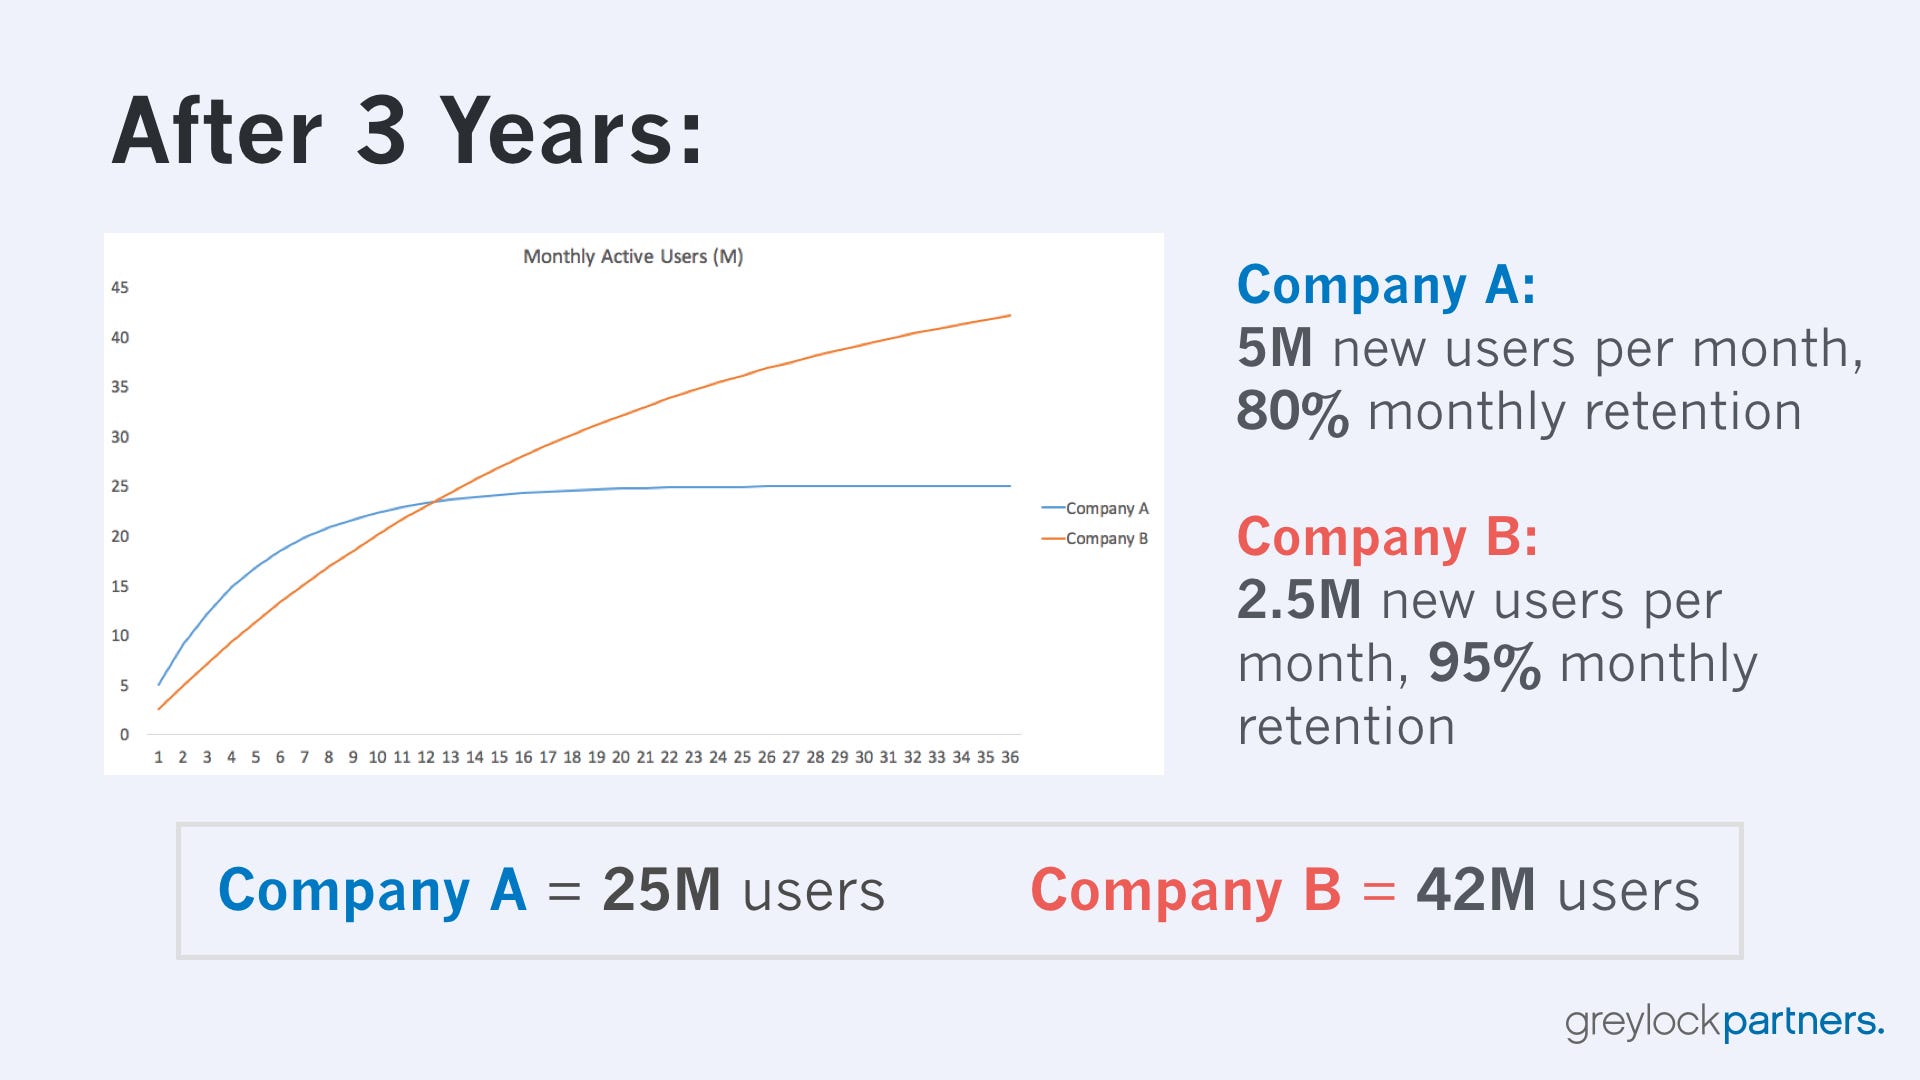
It is therefore very key to track the retention of your business: monthly/yearly churn (amount unsubscribe measured as a percentage of total amount of users), amount of users inactive for more than 1 month, etc.
We often talk about CRR (customer retention rate) and DRR (Dollar retention rate)
7/ Marketing ROI Metrics
On a more tactical level, you want to know if you are doing well in your marketing activities. It is therefore important to compare them one with another and further deploy the most successful ones only. The key metric here is the ROI. The ideal way to calculate ROI is $ earned vs $ invested. Sometimes it is possible, specifically if you track the lead sources and measure lead to customer conversion along the funnel. It is however often not that simple. Might be because some investments are not directly linked to leads or revenue (i.e. awareness). Let’s have a look at the possible scenarios:
Lead generation
Amount of leads per $ invested. $ earned per $ invested. Lead to customer conversion. time from the first touchpoint to MQL, SQL, and customer conversion.
Cross & Up-Selling
$ earned per $ invested. Opportunity conversion rate. Amount of opportunities per $ invested.
Retention
CRR on the target audience after vs. before.
Awareness
Reach, Qualified Reach, Mentions.
8/ Customer ROI
Supporting customers has a cost, specifically in B2B. Whether it is a fixed or marginal cost, it will impact your bottom line. It is therefore key for you to measure and maximize your return on investment on customers. That will be key to continue building great products and services to them as well. There are two main metrics here:
Customer Acquisition Cost (CAC)
Tha represents the $ invested to get one customer. You can measure per type of customer. To have a high-level idea, you can divide your sales and marketing costs (incl. people), for a given period by the # of customers you converted during that period.
Life Time Value (LTV)
That’s the total revenue brought by one customer from the day he becomes a customer to the day he stops using your product. It is also measured in $.
It is key that your LTV is significantly higher than your CAC. You should measure how fact your LTV break even your CAC (ideally less than 12 months) and then how many times it multiplies the CAS overall (ideally LTV = 3*CAC minimum).
9/ Productivity
For your product to be successful, you need it to be awesome (although sometimes great is enough) …and for this you’ll need to continuously improve it to answer users’ needs and deliver additional value. For this, your product development needs to be efficient. You’ll look at other types of metrics such as product/feature velocity or product/feature quality measurement.
Hopefully, these metrics make sense to you. If you want more info about how to track one of them, feel welcome to reach out on twitter or comment below. If they seem clear to you, the next step is to get them tracked and reported. I’ll come back to that in the next article. Another key aspect will be the agility to make decisions upon them but also to refine them based on the type of customer, market, and tactics deployed.
By the way, beyond metrics, do not forget to visit your customers, talk to them, and observe them. When it comes to understanding your customers, 1 hour with them worth more than many things out there.
I hope you found this article valuable and useful. Feel welcome to share your thoughts in the comments area. Let’s stay in touch.
